by | Dr Anesee Ibrahim, Senior Reseach Fellow, INTAN
This study is a follow up to the first Study on the Perception of JPA Staff towards the Implementation of JPA Transformation which was conducted in August 2013. The second Study on the Perception of JPA Staff towards the Implementation of JPA Transformation was carried out by INTAN in December, 2013. A total of 337 responses were recorded by the online system which was opened from the 12th until the 27th of the month.
Methodology
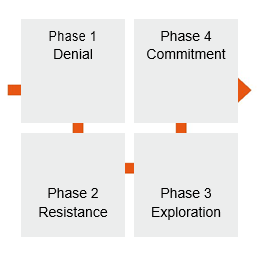
In the first study, reaction of JPA staff towards the transformation process was gauged using a few items chosen from the Kubler-Ross model. Those items however, were not particularly measuring a specific construct. Rather, analyses were conducted on item-by-item basis. For this follow up study, another model was chosen to become the basis, namely the Change Curve developed by Dennis T. Jaffe and Cynthia Scott1. This model divides the stages that human beings go through as they react to dramatic changes that occur around them into four phases, namely denial, resistance, exploration and commitment.In the context of this study, this model explains the phases that each individual JPA staff passes through as a reaction to the changes brought about by the implementation of JPA Transformation which had started since May 2013.
The first phase, denial, begins when people hear about the change, but they choose to ignore the change and act as if nothing is happening. They are comfortable with the status quo and decide not to pay any attention to the vast amount of information that suggests change process must be implemented. Following denial, resistance begins when there is a realisation that change will happen, whether they like it or not. The realisation is followed by feelings of upset, anger,and frustration over what is happening. They feel hardship, lack of confidence and not ready to respond to the change.
People move into exploration when they acknowledge their feelings and accept that change is necessary and important. They start to think about what they can do and what is possible. They decide to make the best of it, learn new skills and seek new ideas. They begin to see the change as an opportunity, rather than a threat. At the commitment phase, the change that has been happening is already accepted. People have regained productivity and feel a sense of relief and accomplishment. They have shifted focus from their own personal fortunes to the organisational and team needs. They have new skills, and will not return to the old ways. They are now ready to face more challenges and new change initiatives.
Findings
Respondents
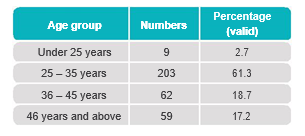
Of the total of 337 responses received until 27th December 2013, 332 were identified to be suitable for analysis. Of this number, 129 respondents were males (39.3%) 199 females (60.7%) and the rest (4) were unidentified. Most of those who responded to the survey were between the age of 25 and 35 (61.3%). This is followed by those between the age of 36 and 45 years (18.7%), and those more than 46 years old (17.2%).
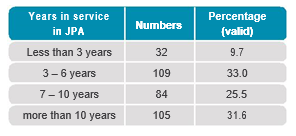
There are more respondents from the Supporting Group compared to the Administrative and Professional Group (195 to 131, or 59.8% to 40.2%). Majority of respondents have been in JPA between 3 to 6 years (33%). This is followed by those who have more than 10 years under their belt working in JPA (31.8%), and then by those who recorded between 7 and 10 years (25.5%).
Instrument
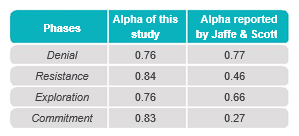
Jaffe and Scott reported the reliability values of the scales which were not very high, especially for resistance and commitment. Low Cronbach’s alpha values provide weakevidence that the items of the scales are consistent in their `movement’. In other words, the scales might not be very reliable. For this study however, the alphas recorded are as high as or higher than those reported by Jaffe and Scott. Not only they are higher, they also fall into the range which some authors consider indicative of strong reliability. The values are presented in the table below.
Overall score
Overall, JPA staff recorded the highest total score for exploration, which is 20.76or 61.5%.The second highestscore was recorded for commitment with a score of 19.06or 56.7%. Meanwhile the total scores for denial and resistance were relatively low at 15.60 and 15.61 respectively (about 40.0% both). Visually, the total scores are presented in the graph below.
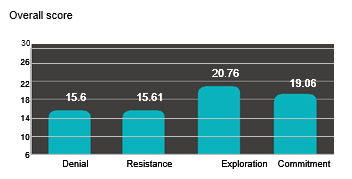
Both exploration and commitment are phases which are positive to the change process. Those are the two phases management wants all their people to be in. On the other hand, denial and resistance are detrimental to the change, at least if majority ofthe people in the organisation could not get out of the phases quickly enough. With the two highest scores recorded for
positive phases (and the two lowest for negative phases), it may be concluded that JPA staff as a whole are at the right stages in terms of their reactions to the implementation of JPA Transformation.
This finding is different to the one from the August 2013 study, where JPA staff was found to be in the stages of `immobilised’ and `bargaining’. The phase of immobilisation is closely related to denial, while bargaining can be said to be somewhere between resistance and exploration. Comparing the findings of the two studies, it is suggested that since August 2013, JPA staff have moved in the positive direction with regards to their reactions to the change process.

The management should not take for granted the seemingly large percentage of those who are already in the exploration and commitment phases.
Comparing between the gender
Score based on gender

As depicted in the chart, there are differences in the scores between male and female respondents for all four phases. We would like to know whether the observed differences from the data are also indicative of `real’ differences in the population of all JPA staff. The following statistical test answers that question.
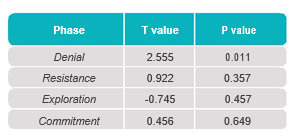
The t-test (comparison of means) shows that there is a significant difference in score between male and female respondents for denial. The difference observed indicates that females have lower denial score than males, suggesting that female staff is at a better position compared to their male colleagues. No similar significance is observed for the other three phases.
Comparing among the age groups
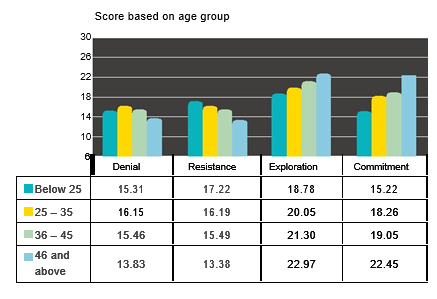
It could be seen visually that the scores for denial and resistance tend to decrease as the respondents’ age gets higher.On the other hand, scores for exploration and commitment increase with age. This observation suggests that as JPA staff gets older, they get more positive in terms of their reactions towards the changes that are happening around them.
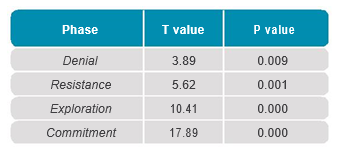
Analysis of variance (ANOVA) was utilised to test whether the observed differences among the age groups were significant for each of the four phases. Results support significant differences (Table above), but the significant difference is not between all age groups. For denial, significant difference exists between those in the age group of 25 to 35 years with those 46 and above (p = 0.005). As observed from the data, those in the latter group score higher.
Similarly for resistance, test indicates that the significant difference is between the age group of 25 to 35 and the 46 and above. As for denial, the older group scores higher in resistance. This suggests that this group has higher resistancelevel compared to those in the age group of between 25 and 35.
For exploration, significant differences occur between those below 25 years and those 46 and above (p = 0.011). In addition, significant difference is also indicated between the age group of 25 to 35 and those 46 and above (p < 0.000). In both instances, the older group scores higher. For commitment, the group of 46 and above scores significantly higher compared to all other age groups, with p values less than 0.000 in all instances.
Findings based on years in JPA
When total scores are compared among the number of years respondents have been with JPA, significant differences are seen for exploration (p = 0.003) and commitment (p < 0.000). There is no difference for denial and resistance.
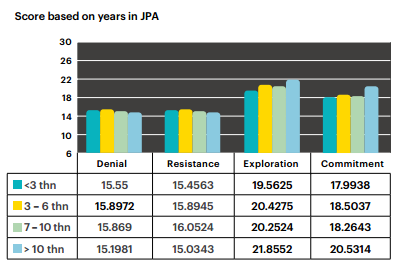
Those who have been in JPA for more than 10 years record higher score in exploration compared to those with 7 to 10 years, 3 to 6 years and those with less than 3 years in JPA (p = 0.019, 0.04 and 0.027 respectively). Meanwhile for commitment, the differences are recorded with p-values of 0.024, 0.004 and 0.002 respectively.
Additional analyses
When the report of the second study was presented to the meeting of JPA Management on the 29th of January, 2014, the meeting proposed that the percentage of staff in each of the four phases of the change curve is identified. In response to the meeting’s decision, the following discussion is presented
- The instrument developed by Jaffe and Scott measures the level of each of the four phases (denial, resistance, exploration and commitment) within an individual as the responses to the on-going changes. In other words, each person has a little bit of denial, resistance, exploration and commitment within him/herself. The phase for which he scores highest among the four is considered as his dominant state. The states of the other three phases are still present within the individual, but they are not the dominant reactions.
- The same analogy can be applied to the overall JPA staff. If all JPA staff is considered as one big individual, ‘he’ would have individual score for each of the four phases, and the phase with the highest score is considered as the dominant reaction phase. As shown earlier, the highest score for the overall JPA staff is for exploration. This is followed quite closely by commitment. Scores for denial and resistance are much lower(both about 40%, compared to 61.5% for exploration and 54.4% for commitment).
- To divide all respondents into four distinct dominant reaction phases as proposed by the meeting, the dominant phase for each individual respondent has to be identified. This is done by identifying the highest score of each of them. Some of the respondents have more than one highest score. In these situations, the cases are considered valid only if the highest scores correspond to adjacent phases (denial and resistance, resistance and exploration, and so on). For these respondents, their dominant phase is taken to be the combination between the two main phases. The results of this analysis are presented in the following pie chart.
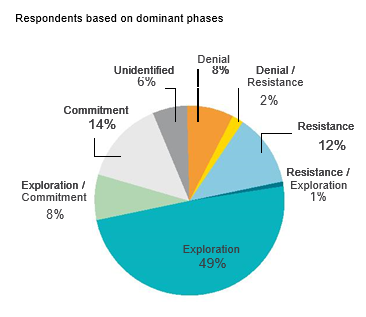
- The chart shows that 8% of JPA staff are dominantly in the state of denial, 12% in resistance, 49% in exploration and 14% in commitment. In addition to the main phases, there are 2% of respondents in between denial and resistance, 1% between resistance and exploration, and 8% between exploration and commitment. A total of 6% have unidentified dominant phasedue to more than two similar highest scores, or two similar highest scores for non-adjacent phases.
- The first two phases are negative states to be in with regards to the staff’s contribution to the implementation of JPA transformation. The other two, meanwhile, are the positive states. Those in the in-between phases can also be considered positive or negative depending on the position. In this regard, the total percentage of all JPA staff who seem to be in the positive states towards the implementation of JPA transformation is 72% (inclusive of the following phases: resistance/ exploration, exploration, exploration/ commitment and commitment). Similar figure for those in the negative states is 22%, while the figure for unidentified states is 6%.
Conclusions
In general, it has been observed that there has been a positive transition among JPA staff in terms of their reaction towards the implementation of JPA transformation. This is concluded after comparing the findings of this study with the one conducted in August 2013. This is quite obvious even though the scores are not as high as proposed by Jaffe and Scott, even for exploration and commitment. More detailed examination also shows that for some sub-groups, the transition has been greater. Female staff is shown to be more positive in denial compared to their male counterparts. This finding is of special interest because in the last study female staff was shown to be less positive towards the transformation process.
More mature respondents (in terms of age and years and service in JPA) recorded more positive transition compared to younger staff, and this is true for all four phases. This finding is a re-emphasis of the previous study. This study also suggests that the positive transition does not depend solely on the staff’s attendance to engagement sessions conducted by any one of the top three. Thus, it may be concluded that the impact seen has been the result of many initiatives at the different levels of the organisation, including the managers in the Bahagian.
Overall, close to three quarters of all JPA staffs seems to be in the positive states of reaction with regards to the implementation of JPA Transformation. The figure for the negative states is 22%. Nevertheless, the management should not take for granted the seemingly large percentage of those who are already in the exploration and commitment phases. The work to ensure all are aboard should continue, in the form of engagement, information sharing, celebration of success and other key change management programmes.


